

The Truth About Beaverton Class Sizes

Beaverton School District leaders regularly state how they put student needs first. One of many claims to support this have been their investments over the past few years to reduce class sizes.
This specific point came up during their in-person Bond Q&A meeting at Beaverton High School on April 18 2022. After being challenged on their poor spending practices during public comments in the April 25 2022 School Board Business Meeting, district personnel and board members again repeated claims about investments made to reduce class sizes.
Are class sizes really getting smaller? At the start of the 2021-22 school year, there were many complaints made to the district about high class sizes through email and public comments, including elementary classes over over 30 children! How can we find the truth? ODE to the rescue!
The Oregon Department of Education makes a great deal of data freely available to the public. Class size reports are available in spreadsheet form by school year (click here to access). You can see data by district, school, grade level, and more. We've taken the time to consolidate the available data for the state and the top 10 school districts (by student enrollment) to show you just how big the class sizes in Beaverton are when compared to others.
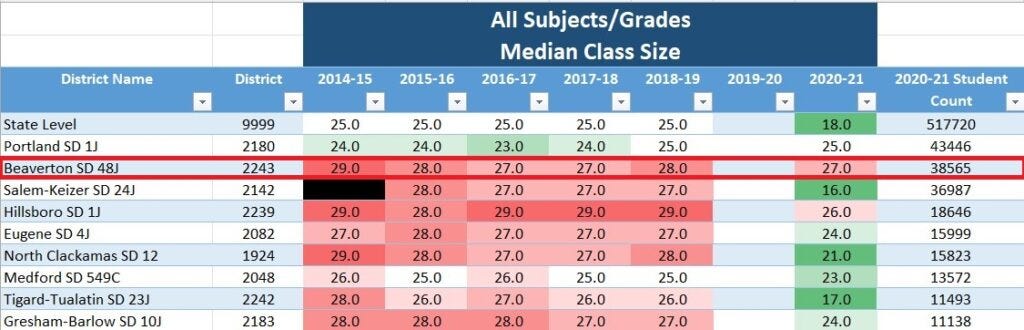
To help make sense of this, look at the 2014-15 school year column. The median class size for the entire state of Oregon was 25 students. Beaverton, Hillsboro, and North Clackamas all tied for the highest median of 29 students. Beaverton consistently has at or near the highest median class size across the top 10 districts in Oregon. Even in the middle of the pandemic, when student enrollment drops around the state drastically reduced class sizes, Beaverton barely saw a change as they once again ended up with the highest class sizes.
A quick note about using median vs average class size and where student to teacher ratios may fit in. Median provides the midpoint for class size, and is useful to prevent outliers from skewing the result. This is likely why ODE uses this method instead of something like student to teacher ratio. This ratio is hard to compare between districts due to what they consider to be a “teacher”. BSD’s definition of a teacher is broader than others, which lets them artificially lower their claimed student to teacher ratio. However, when you simplify things by just focusing on how big their class sizes are, you see what’s really going on in schools.
So while it is true that Beaverton did not lay off teachers in the 2020-21 school year, even with the massive enrollment drop, they still had incredibly high class sizes. Now think about this - what if enrollment hadn't dropped so drastically? Just how big would class sizes have been? This is incredibly important because they effectively lucked into smaller class sizes with the unpredictably high drop in enrollment. Luck, like hope, is NOT a strategy.
[Note about chart/graphic] ODE did not have data available for the 2019-20 school year. There is also a significant delay in them releasing the data for each school year, which is why the 2021-22 data is not available. The 2020-21 data was just released in February 2022. Salem-Keizer data was not provided for 2014-15 per a note in the raw data from ODE that it was missing information.