Oregon K-12 Student Assessment Results Continue to Decline
For those looking for the simple, online dashboard I created to view assessment results for your school district or the entire state of Oregon from 2014-15 to 2023-24, you can find it here: Oregon Student Assessment Results
[October 7, 2024 Update]
In late September, the Oregon Department of Education (ODE) held off on releasing the assessments results for the 2023-24 school year. This unexpected delay was was explained by Assistant Superintendent Dan Farley in this September 23 2024 email to all Oregon Superintendents, Principals, and other relevant roles. Included in that email was this reason:
…ODE staff need additional time to make the data more accessible by formatting them into data visualizations.
ODE did release the assessment results and their data visualizations on Thursday, October 3rd. Those graphs and tables of data (aka data visualizations) were provided in this document. After reviewing all of them, it appears many were built to provide a misleading view into student achievement. For one thing, the document led off with multiple pages of charts on “Participation Rates” (the percentage of students taking the tests). This is not what’s top of mind for most parents. What they care about are the results in their kids’ schools, school district, and the state overall.
Here is one example of misleading data from ODE.

By only including the past three years of results, you don’t see the significant drop caused by the pandemic lockdown learning loss. Had they included the results from the last full year of in-person school prior to the pandemic (2018-19), you would have seen the score for “All Students” (upper-left in the picture below) at 53.4%. A 10% drop in proficiency is huge, yet ODE would prefer not to arm parents, community members, and legislators with the reality of the situation they helped create.
I encourage you to continue reading the original article below, as it provides more details surrounding our assessment system and results, education funding, and a second dashboard I created to compare assessment results between Oregon & Washington.
[Original article]
In September 2022, the Oregon Department of Education (ODE) released the results for the previous year’s Oregon Statewide Assessment System. ODE provided some guidance to those evaluating the results in this document about the system:
The Oregon Statewide Assessment System evaluates systems, not students. The primary purpose of this equity-centered assessment system is to measure student group learning (as delineated by relevant content area standards), so that meaningful assertions can be made about how well schools, districts, and the state are fulfilling their responsibility to provide all students with high quality grade level educational opportunities.
Put another way, students in specific grade levels take assessments in areas like Math, English Language Arts, and Science; and over time that data can help us see how well schools are generally doing. As they also capture demographic data, we can compare different groups of students to see their outcomes (i.e. Males, Females, Black, White, etc.) The data doesn’t tell you WHY or HOW the results are changing year over year, they just provide the results.
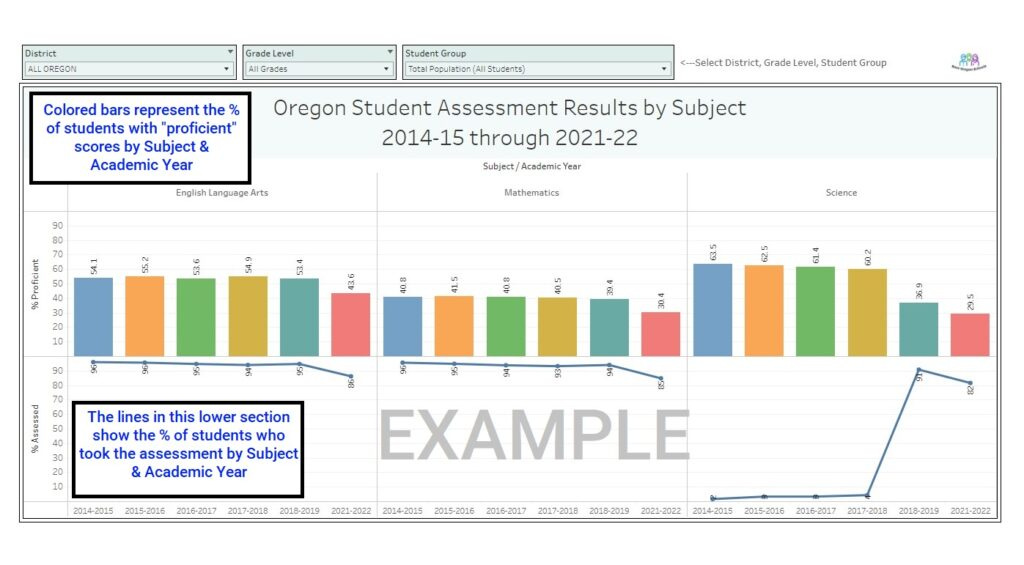
Unfortunately ODE doesn’t make it easy for the general public to review the data. While they do provide access to the raw data for each available school year on their Assessment Group Reports page, a concerned parent would have to download and comb through multiple, large spreadsheets to extract the figures. The good news is, I happen to be a bit of a data geek, so I built an online dashboard to make it easy for anyone to access the results from a computer, tablet, or phone.

This dashboard includes results from the 2014-15 to the 2021-22 school years, with the exception of 2019-20 and 2020-21 as ODE did not provide that data due to the pandemic). You’ll see three drop-down boxes that allow you to view the data by any combination of this data:
District (or select “ALL OREGON” for statewide results)
Grade Level
Student Group
The feedback I received on this dashboard was overwhelmingly positive. It felt great to be able to provide information to people across the state, but on the flip side I was frustrated that ODE did not. I reached out to offer ODE access to this dashboard and the source design (no cost, no strings attached), but I did not hear back. Given how poor the results were, it makes sense why they wouldn’t want to make it easy for anyone to see.
As you saw in the quote at the start of this story, the assessment results are to measure the SYSTEM and not the STUDENTS. While the nearly two years in a COVID-19 lockdown led to some dramatic drops in results, prior to that we had been seeing declining results. Many people, including teachers and administrators often say it is due to poor funding, but is that really the issue?
A quick tangent on Oregon Education Funding
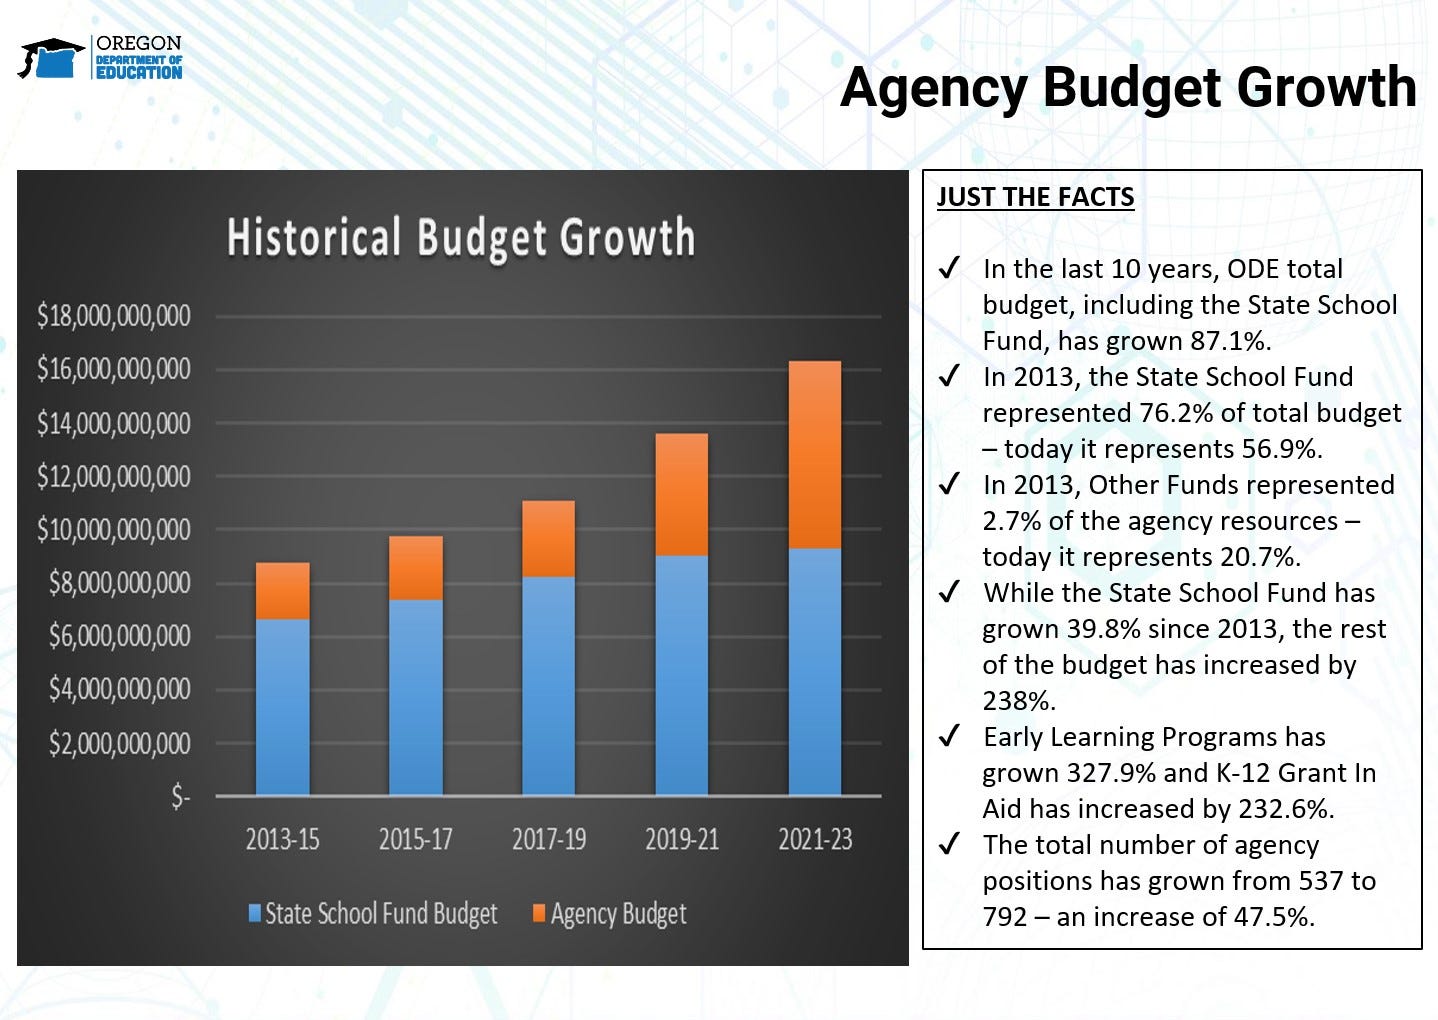
Public education funding in Oregon has been increasing dramatically over the past 10 years, but their own data makes it clear their strategy and use of those funds have failed. Just take a look at this slide from an ODE presentation in September 2021. What really stands out to me is the explosive growth in the orange bars, which represent ODE’s own “Agency Budget”.

I’ve done a lot of research into how ODE is funded and where those funds go. The short version is this: Oregon public education funding has become incredibly complex. In 2013, ODE’s portion of overall public education funding was 24%. Now in the current 2021-23 biennium, it has ballooned up to 43%. This is because much of the increased funding provided to public education has been tied up in programs managed by ODE rather than going directly to school districts.
So honestly from a teacher’s or administrator’s perspective, I believe them when they say they lack the funding needed to deliver good educational outcomes. The assessment results highlight this as well. The problem is the money isn’t making it to the classrooms.
Again that graphic makes it very clear that Oregon public education has been growing significant, and is far outpacing the overall student enrollment in public schools. Just as we saw with the assessment data, ODE doesn’t offer any way to hold them accountable on how they’ve been using or distributing these increasingly massive sums of taxpayer dollars. I sincerely hope governor-elect Tina Kotek will select a new leader for ODE, and that their first official action will be to conduct an audit of all funded programs. Accountability is desperately needed. Now back to our original story…
Comparing Oregon to other states
Quite a few people reached out to ask how Oregon results compared to other states. This seemingly simple question resulted in many hours of frustrating research on my part. One issue is that not every state uses the same type of assessments. Oregon uses the Smarter Balanced assessments, as do other states like Washington and California. However, when I was searching for the data in late September I found that not every state releases their data at the same time or in a way that would be easy to incorporate into a dashboard.
With that said, I was able to obtain assessment data for our neighbor to the north (Washington), and I used it to put together a second public dashboard to provide some high-level comparisons between the two states.

What was interesting to see was how Washington had been generally improving over the first few years prior to the pandemic while Oregon results were flat to declining. I encourage you to check out the dashboards and play around with the different drop-down choices to compare various groups, grades, and so on.
This last section is provided to answer other questions I received about how to understand the results - specifically, what they mean when they use the term “proficient”. I also wanted to give a bit more details on the assessment system we use in Oregon and where to go for more information. If you feel you’ve already topped out on data for the day, I understand! As always, I welcome any questions or feedback you may have. And now for those remaining brave souls, let’s dive into proficiency…
What does “Proficient” mean?
Oregon uses the Smarter Balanced assessments, and their website has lots of information about their scaled scoring methodology. Here’s our attempt to make it as simple and straightforward as possible.
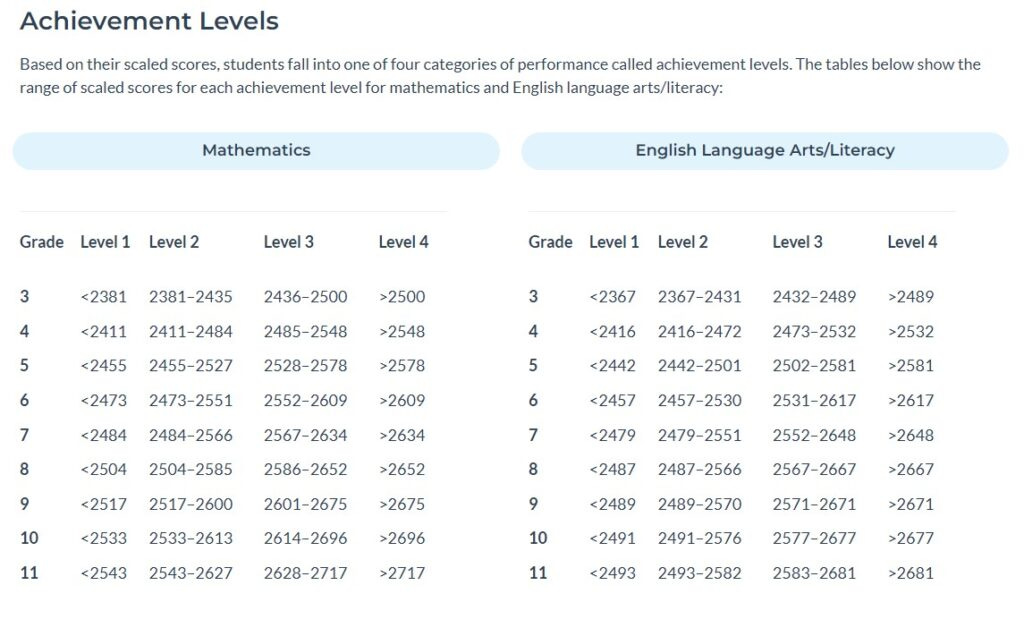
For each grade level and subject area, scores are broken out into four ranges. They refer to these as “Levels”, and here’s a brief description of what they mean a student can demonstrate for each subject:
Level 1: Minimal understanding of and ability to apply knowledge
Level 2: Partial understanding of and ability to apply knowledge
Level 3: Adequate understanding and ability to apply knowledge
Level 4: Thorough understanding of and ability to apply knowledge
A student is considered “proficient” if they achieve a score in Level 3 or 4. So the dashboard we created and the charts you’ve seen on the news are based on the % of students who scored in level 3 or 4.

What makes this complex is the scores required for each level increase with each grade level. In essence the requirements to be proficient go up as the student gets older. This makes sense as these assessments are intended to assess their readiness for college, and we’d have higher expectations of proficiency for a 3rd grader vs an 11th grader. I included a picture that shows the scores for each level by grade & subject.
The Smarter Balanced website has a lot more info as well as a YouTube video that explains how they determined the necessary scores for each grade and level.


