


Oregon’s high-school graduation rate is rising. Yet far fewer students are demonstrating proficiency in reading, writing, math, and science than before the pandemic. That disconnect deserves a closer look.
I’ve updated my Oregon assessment results dashboard to put those trends together, along with the latest data available. You can explore statewide results or dig into any district, grade level, and student group, using your phone, tablet, or computer.
When I launched the original dashboard in 2022, I wanted to make this information easy to find and understand. The new version adds graduation rates through 2024-251 alongside assessment results through 2025-26.
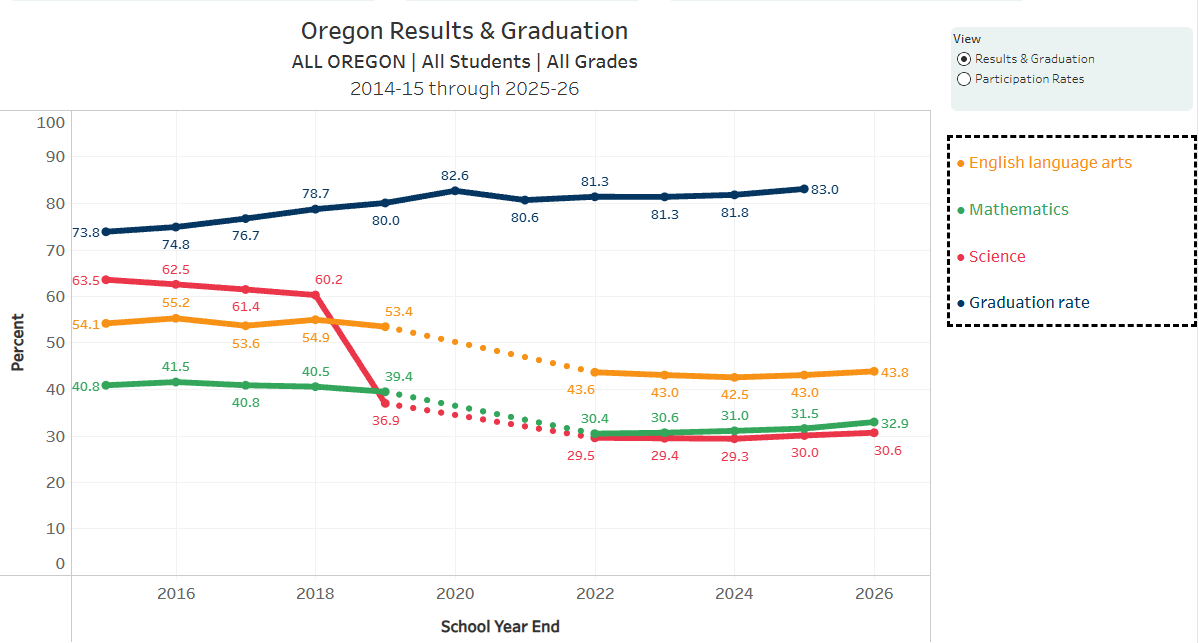
Before going into the more recent results, I want to address the sharp drop in science results after 2018. Oregon introduced a new, more rigorous science assessment in 2018-19. The drop reflects a change in the test, so it shouldn’t be read as a comparable one-year collapse in learning.
In the latest results, there’s a slight uptick in all three subjects. But five school years after widespread closures ended, proficiency remains well below 2018-19: English language arts fell from 53.4% to 43.8%, math from 39.4% to 32.9%, and science from 36.9% to 30.6%. Those declines mean that, for every 100 students tested, roughly 6-10 fewer are demonstrating proficiency than before the pandemic, depending on the subject. To put it another way, that drop represents tens of thousands of kids across Oregon. Just let that sink in.
Meanwhile, graduation rose from 80.0% in 2018-19 to 83.0% in 2024-25, the latest graduation year available. More diplomas may be worth celebrating. However, they don’t tell us whether students are better prepared.
Compare eleventh grade with graduation the next year
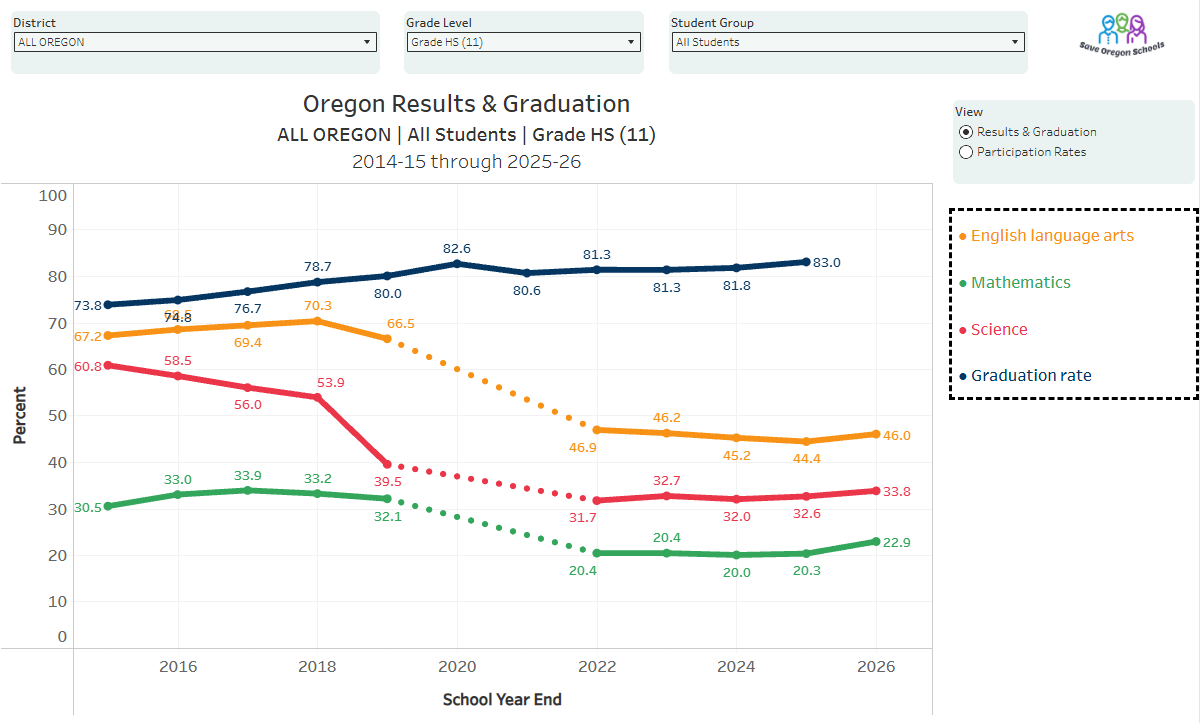
Eleventh grade is the last statewide assessment checkpoint. To compare it with graduation, look one year ahead: the assessment point marked 2018 represents 2017-18 juniors, who would generally graduate in 2018-19.
Early in the chart, English language arts (ELA) proficiency and the following year’s graduation rate both rose. ELA proficiency increased from 67.2% in 2014-15 to 70.3% in 2017-18, while the corresponding graduation rates climbed from 74.8% to 80.0%.
Then they diverged. ELA proficiency dropped to 66.5% in 2018-19, but the following year’s graduation rate rose to 82.6%. By 2025-26, just 46.0% of tested juniors were proficient in ELA and 22.9% in math.
These assessments and graduation rates measure different things, and this chart doesn’t track individual students. Still, I would expect improving graduation rates to come with stronger evidence of learning. To understand the disconnect, we also need to consider how Oregon’s graduation requirements and grading practices have changed.
What changed besides student learning?
Graduation requirements and grading practices have changed during this period, too.
Oregon previously required students to demonstrate essential skills in reading, writing, and math through approved assessments or work samples. Following pandemic waivers, the legislature suspended that requirement through 2023-24 under Senate Bill 744. In October 2023, following the Oregon Department of Education’s (ODE) recommendation, the State Board of Education extended the suspension through 2027-28, using its rulemaking authority without a new law extending it. Course credits and other graduation requirements remain.
Meanwhile, ODE has promoted “equitable grading” practices, including a professional learning course to help schools change how they grade students. The stated goals include reducing bias and making grades better reflect learning. Among the examples ODE shares, Springfield’s 2021-22 guidelines recommend a 50% minimum score and require opportunities for retakes and late work without grade penalties, within established deadlines.
Those distinctions matter. A student who learns more and demonstrates it on a retake has made academic progress. Raising a recorded score through a minimum-grade rule can increase an average without additional evidence of learning.
These policies vary by district, and this dashboard cannot isolate their effects on graduation rates. But they give us another reason to ask what rising grades and graduation rates actually represent. How much reflects stronger academic preparation, and how much reflects changes in the requirements and calculations? Education leaders should be able to show us the evidence.
Students who started school after the closures
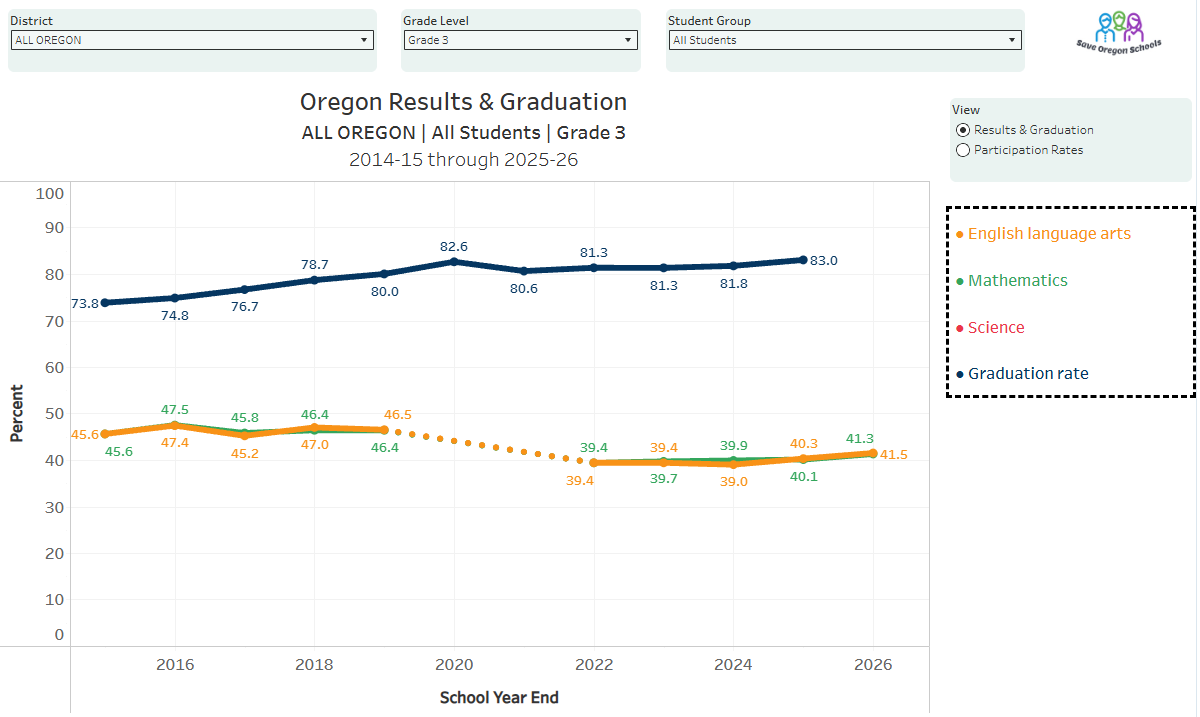
Third grade is especially revealing. Students who started kindergarten in 2021-22 generally reached third grade in 2024-25, and those who started in 2022-23 reached it in 2025-26. We now have two years of results for children who started their K-12 journey after the widespread school closures.
Both groups remain below earlier third-grade classes. In 2025-26, proficiency was 41.5% in ELA and 41.3% in math, compared with 46.5% and 46.4%, respectively, in 2018-19.
That doesn’t erase the pandemic’s effects on early childhood or family life. It does make “they missed school during closures” an inadequate explanation for what we’re seeing. The persistent shortfall deserves answers about what’s happening in classrooms today.
You may have noticed there is no line representing science. That’s because third graders don’t take the science assessment. Also just for clarification, the graduation line follows the selected district and student group only, so changing grades doesn’t change it.
Lower participation does not explain the full decline
Here we use the View selector to switch to “Participation Rates,” which shows the percentage of eligible students who took each assessment.
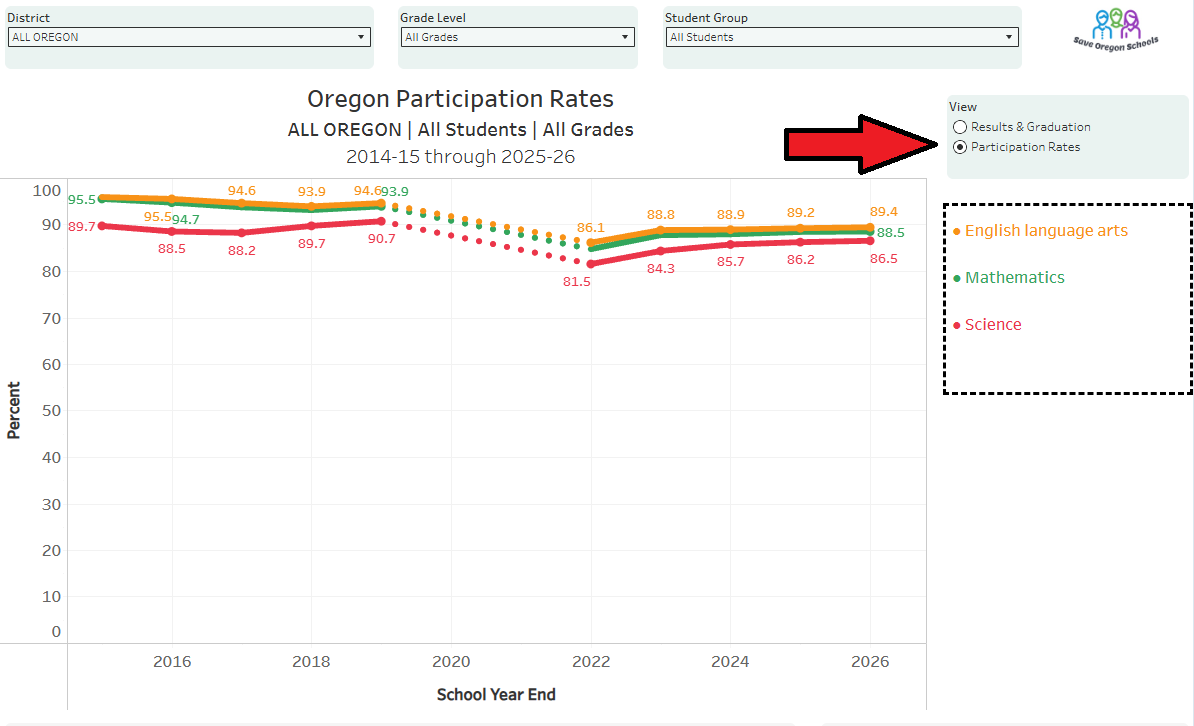
I’ve recently seen lower participation used as an explanation for poor results. Statewide participation remains about 4-5 percentage points below 2018-19. Who takes the tests matters, but the size of that drop cannot simply explain away the proficiency decline.
Let’s take a look at English language arts results to illustrate my point. Participation fell from 94.6% to 89.4%. Suppose we restored those missing 5.2 percentage points of participation and every added student scored proficient. Even that generous assumption would raise today’s proficiency rate from 43.8% to only about 46.9%, still well short of the earlier 53.4%. The same calculation leaves gaps in math and science, too.
The point is this: even if the entire drop in participation came from proficient students, it still wouldn’t explain the full decline in results.
Your turn: find your district and explore the results
OK, now it’s your turn! Please open the dashboard and look up your local school district. Click or tap the District dropdown and choose your district. The Grade Level and Student Group selectors work the same way. Leave “ALL OREGON” selected to see the statewide picture, then try different combinations to see where outcomes have improved or fallen behind.
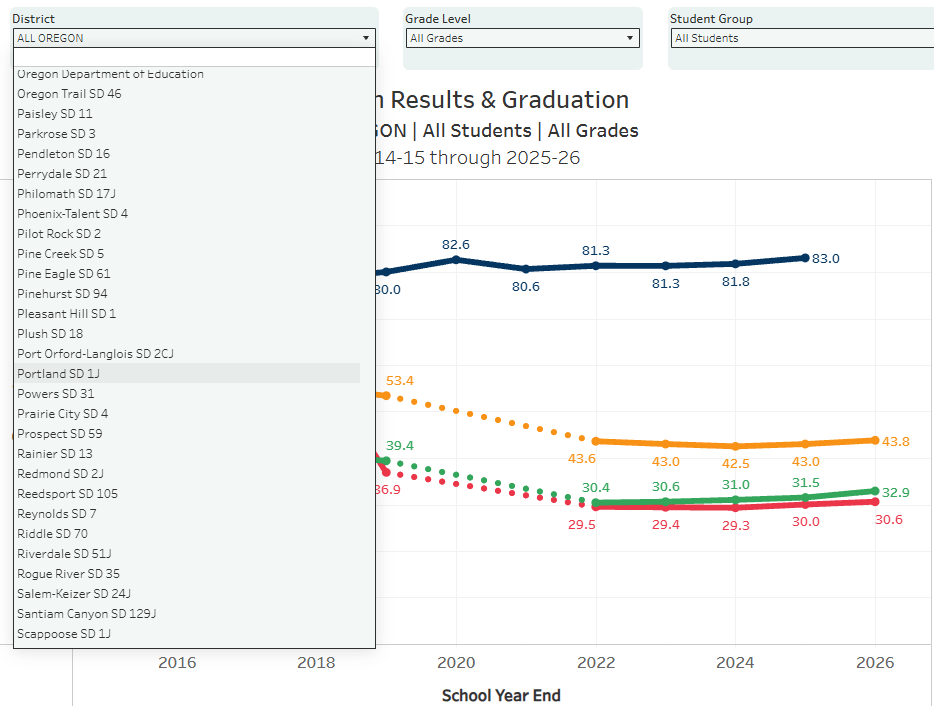
All data comes from the Oregon Department of Education, with specific source citations at the bottom of the dashboard. “Proficient” means a student met or exceeded the assessment’s achievement standard.
A couple of details will help you read the charts. The horizontal axis uses the year the school year ended (i.e. 2018 means the 2017-18 school year).
Also keep in mind that dotted lines represent gaps in the data, such as when assessments were canceled in 2019-20. Other gaps reflect unavailable or suppressed ODE results, including small student groups. Those reporting limits come from ODE.
Now that you’re equipped with this tool and all the data, be sure to use it when you speak with education leaders, legislators, and other public officials. Ask what explains these trends, what evidence shows their plans are working, and what they plan to do to drive meaningful improvement for Oregon’s future—our kiddos!
And please share this article and the dashboard with others. The more people who can see the results for themselves, the harder they are to ignore.
Graduation data typically arrives in late January, several months after the assessment results for the same school year.